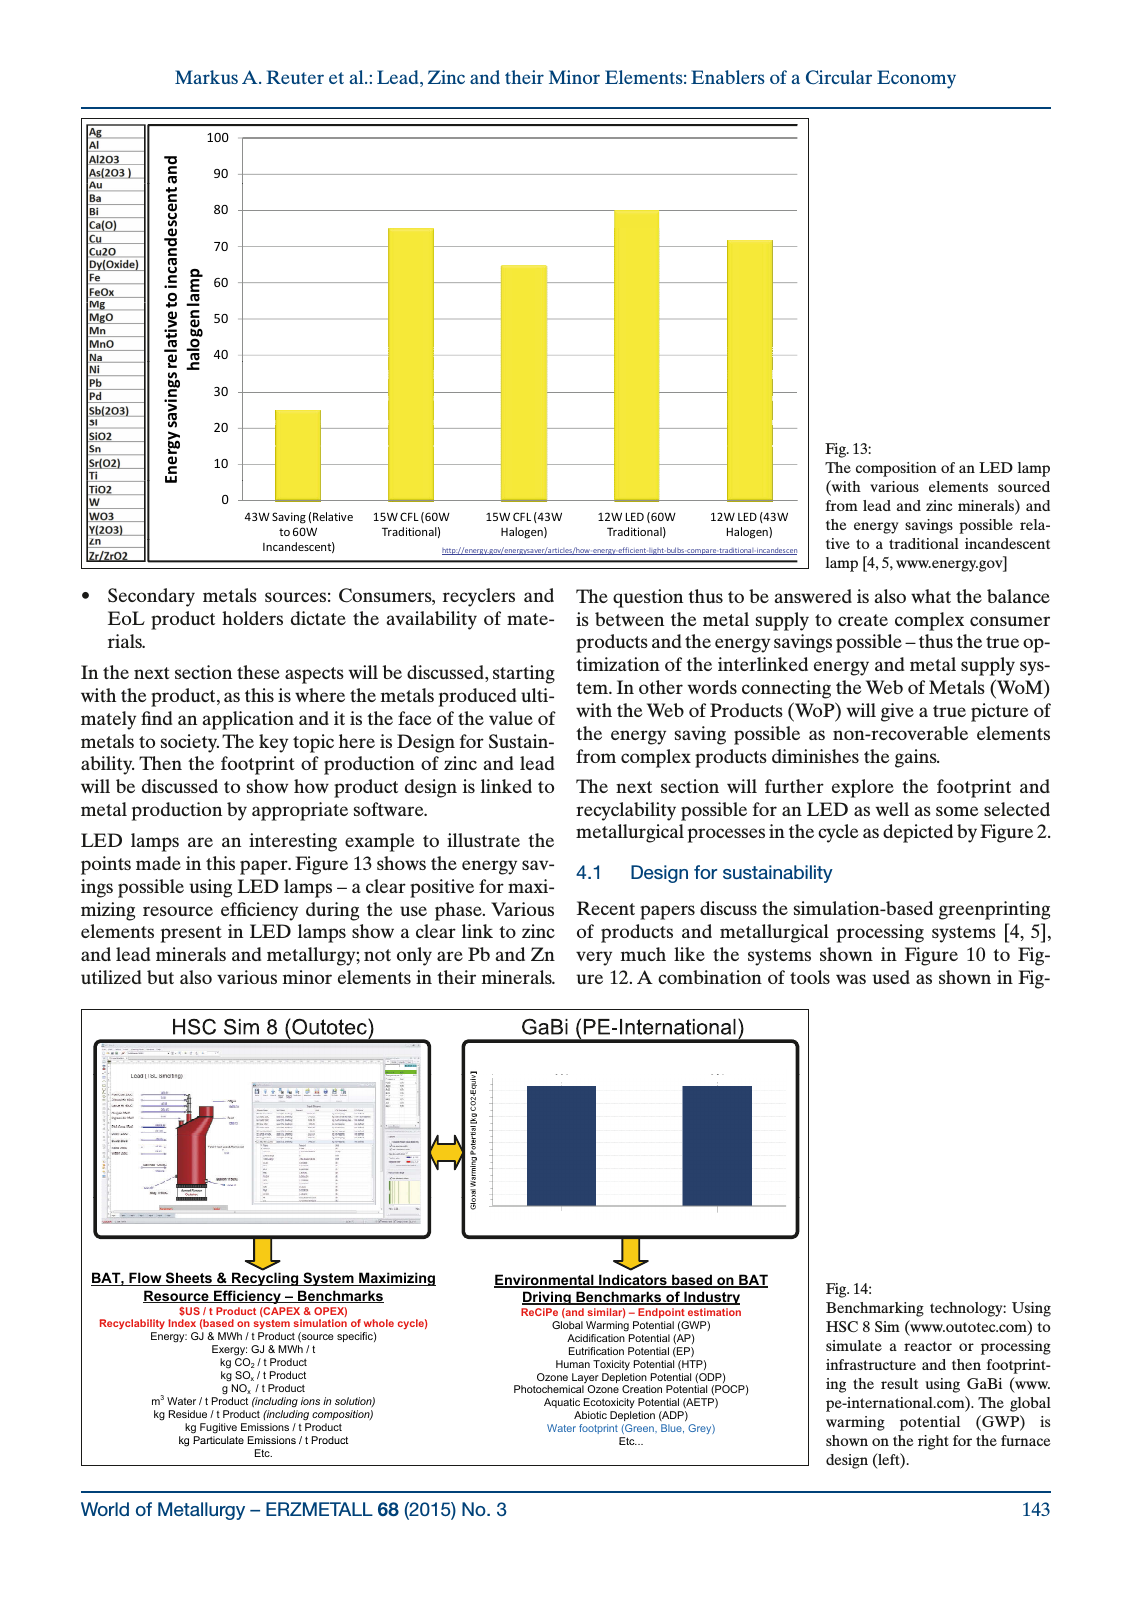
World of Metallurgy ERZMETALL 68 2015 No 3 143 Markus A Reuter et al Lead Zinc and their Minor Elements Enablers of a Circular Economy Secondary metals sources Consumers recyclers and EoL product holders dictate the availability of mate rials In the next section these aspects will be discussed starting with the product as this is where the metals produced ulti mately find an application and it is the face of the value of metals to society The key topic here is Design for Sustain ability Then the footprint of production of zinc and lead will be discussed to show how product design is linked to metal production by appropriate software LED lamps are an interesting example to illustrate the points made in this paper Figure 13 shows the energy sav ings possible using LED lamps a clear positive for maxi mizing resource efficiency during the use phase Various elements present in LED lamps show a clear link to zinc and lead minerals and metallurgy not only are Pb and Zn utilized but also various minor elements in their minerals The question thus to be answered is also what the balance is between the metal supply to create complex consumer products and the energy savings possible thus the true op timization of the interlinked energy and metal supply sys tem In other words connecting the Web of Metals WoM with the Web of Products WoP will give a true picture of the energy saving possible as non recoverable elements from complex products diminishes the gains The next section will further explore the footprint and recyclability possible for an LED as well as some selected metallurgical processes in the cycle as depicted by Figure 2 4 1 Design for sustainability Recent papers discuss the simulation based greenprinting of products and metallurgical processing systems 4 5 very much like the systems shown in Figure 10 to Fig ure 12 A combination of tools was used as shown in Fig Fig 13 The composition of an LED lamp with various elements sourced from lead and zinc minerals and the energy savings possible rela tive to a traditional incandescent lamp 4 5 www energy gov Figure 13 Reuter 90 100 an d 7 0 8 0 de sce nt a 6 0 7 0 o i nc an d am p 40 50 ela tiv e t alo ge n l 3 0 av ing s re h 10 20 En erg y s 0 43W Saving Relative to 6 0 W 15W CFL 6 0 W Traditional 15W CFL 43W Halogen 12W LED 6 0 W Traditional 12W LED 43W Halogen E I ncan descent http energy gov energys a ver articles how energy ef ficient light bulbs com pare traditiona l i nca ndes cen Fig 14 Benchmarking technology Using HSC 8 Sim www outotec com to simulate a reactor or processing infrastructure and then footprint ing the result using GaBi www pe international com The global warming potential GWP is shown on the right for the furnace design left Figure 14 Reuter BAT Flow Sheets Recycling System Maximizing Resource Efficiency Benchmarks US t Product CAPEX OPEX R l bilit I d b d t i l ti f h l l Environmental Indicators based on BAT Driving Benchmarks of Industry ReCiPe and similar Endpoint estimation ecyc a y n ex ase on sys em s mu a on o w o e cyc e Energy GJ MWh t Product source specific Exergy GJ MWh t kg CO2 t Product kg SOx t Product Global Warming Potential GWP Acidification Potential AP Eutrification Potential EP Human Toxicity Potential HTP Ozone Layer Depletion Potential ODP g NOx t Product m3 Water t Product including ions in solution kg Residue t Product including composition kg Fugitive Emissions t Product kg Particulate Emissions t Product Photochemical Ozone Creation Potential POCP Aquatic Ecotoxicity Potential AETP Abiotic Depletion ADP Water footprint Green Blue Grey Etc Etc
Hinweis: Dies ist eine maschinenlesbare No-Flash Ansicht.
Klicken Sie hier um zur Online-Version zu gelangen.
Klicken Sie hier um zur Online-Version zu gelangen.