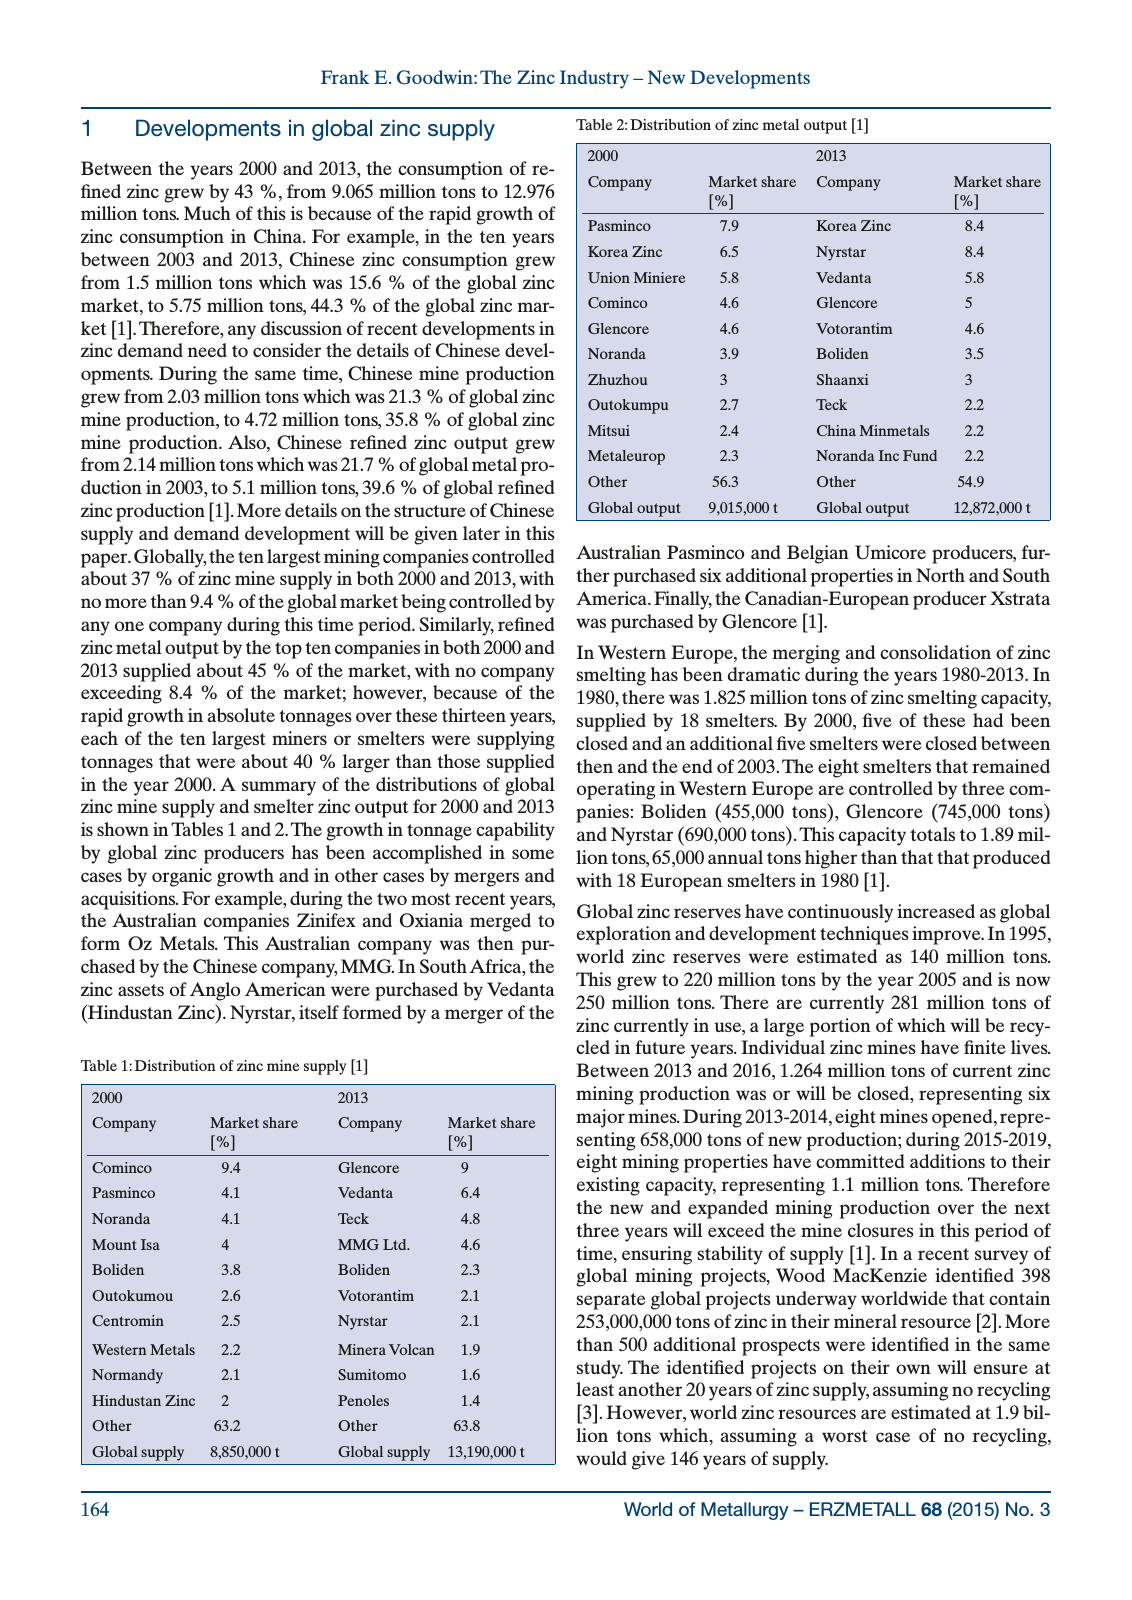
World of Metallurgy ERZMETALL 68 2015 No 3164 Frank E Goodwin The Zinc Industry New Developments 1 Developments in global zinc supply Between the years 2000 and 2013 the consumption of re fined zinc grew by 43 from 9 065 million tons to 12 976 million tons Much of this is because of the rapid growth of zinc consumption in China For example in the ten years between 2003 and 2013 Chinese zinc consumption grew from 1 5 million tons which was 15 6 of the global zinc market to 5 75 million tons 44 3 of the global zinc mar ket 1 Therefore any discussion of recent developments in zinc demand need to consider the details of Chinese devel opments During the same time Chinese mine production grew from 2 03 million tons which was 21 3 of global zinc mine production to 4 72 million tons 35 8 of global zinc mine production Also Chinese refined zinc output grew from 2 14 million tons which was 21 7 of global metal pro duction in 2003 to 5 1 million tons 39 6 of global refined zinc production 1 More details on the structure of Chinese supply and demand development will be given later in this paper Globally the ten largest mining companies controlled about 37 of zinc mine supply in both 2000 and 2013 with no more than 9 4 of the global market being controlled by any one company during this time period Similarly refined zinc metal output by the top ten companies in both 2000 and 2013 supplied about 45 of the market with no company exceeding 8 4 of the market however because of the rapid growth in absolute tonnages over these thirteen years each of the ten largest miners or smelters were supplying tonnages that were about 40 larger than those supplied in the year 2000 A summary of the distributions of global zinc mine supply and smelter zinc output for 2000 and 2013 is shown in Tables 1 and 2 The growth in tonnage capability by global zinc producers has been accomplished in some cases by organic growth and in other cases by mergers and acquisitions For example during the two most recent years the Australian companies Zinifex and Oxiania merged to form Oz Metals This Australian company was then pur chased by the Chinese company MMG In South Africa the zinc assets of Anglo American were purchased by Vedanta Hindustan Zinc Nyrstar itself formed by a merger of the Australian Pasminco and Belgian Umicore producers fur ther purchased six additional properties in North and South America Finally the Canadian European producer Xstrata was purchased by Glencore 1 In Western Europe the merging and consolidation of zinc smelting has been dramatic during the years 1980 2013 In 1980 there was 1 825 million tons of zinc smelting capacity supplied by 18 smelters By 2000 five of these had been closed and an additional five smelters were closed between then and the end of 2003 The eight smelters that remained operating in Western Europe are controlled by three com panies Boliden 455 000 tons Glencore 745 000 tons and Nyrstar 690 000 tons This capacity totals to 1 89 mil lion tons 65 000 annual tons higher than that that produced with 18 European smelters in 1980 1 Global zinc reserves have continuously increased as global exploration and development techniques improve In 1995 world zinc reserves were estimated as 140 million tons This grew to 220 million tons by the year 2005 and is now 250 million tons There are currently 281 million tons of zinc currently in use a large portion of which will be recy cled in future years Individual zinc mines have finite lives Between 2013 and 2016 1 264 million tons of current zinc mining production was or will be closed representing six major mines During 2013 2014 eight mines opened repre senting 658 000 tons of new production during 2015 2019 eight mining properties have committed additions to their existing capacity representing 1 1 million tons Therefore the new and expanded mining production over the next three years will exceed the mine closures in this period of time ensuring stability of supply 1 In a recent survey of global mining projects Wood MacKenzie identified 398 separate global projects underway worldwide that contain 253 000 000 tons of zinc in their mineral resource 2 More than 500 additional prospects were identified in the same study The identified projects on their own will ensure at least another 20 years of zinc supply assuming no recycling 3 However world zinc resources are estimated at 1 9 bil lion tons which assuming a worst case of no recycling would give 146 years of supply Table 1 Distribution of zinc mine supply 1 2000 2013 Company Market share Company Market share Cominco 9 4 Glencore 9 Pasminco 4 1 Vedanta 6 4 Noranda 4 1 Teck 4 8 Mount Isa 4 MMG Ltd 4 6 Boliden 3 8 Boliden 2 3 Outokumou 2 6 Votorantim 2 1 Centromin 2 5 Nyrstar 2 1 Western Metals 2 2 Minera Volcan 1 9 Normandy 2 1 Sumitomo 1 6 Hindustan Zinc 2 Penoles 1 4 Other 63 2 Other 63 8 Global supply 8 850 000 t Global supply 13 190 000 t Table 2 Distribution of zinc metal output 1 2000 2013 Company Market share Company Market share Pasminco 7 9 Korea Zinc 8 4 Korea Zinc 6 5 Nyrstar 8 4 Union Miniere 5 8 Vedanta 5 8 Cominco 4 6 Glencore 5 Glencore 4 6 Votorantim 4 6 Noranda 3 9 Boliden 3 5 Zhuzhou 3 Shaanxi 3 Outokumpu 2 7 Teck 2 2 Mitsui 2 4 China Minmetals 2 2 Metaleurop 2 3 Noranda Inc Fund 2 2 Other 56 3 Other 54 9 Global output 9 015 000 t Global output 12 872 000 t
Hinweis: Dies ist eine maschinenlesbare No-Flash Ansicht.
Klicken Sie hier um zur Online-Version zu gelangen.
Klicken Sie hier um zur Online-Version zu gelangen.