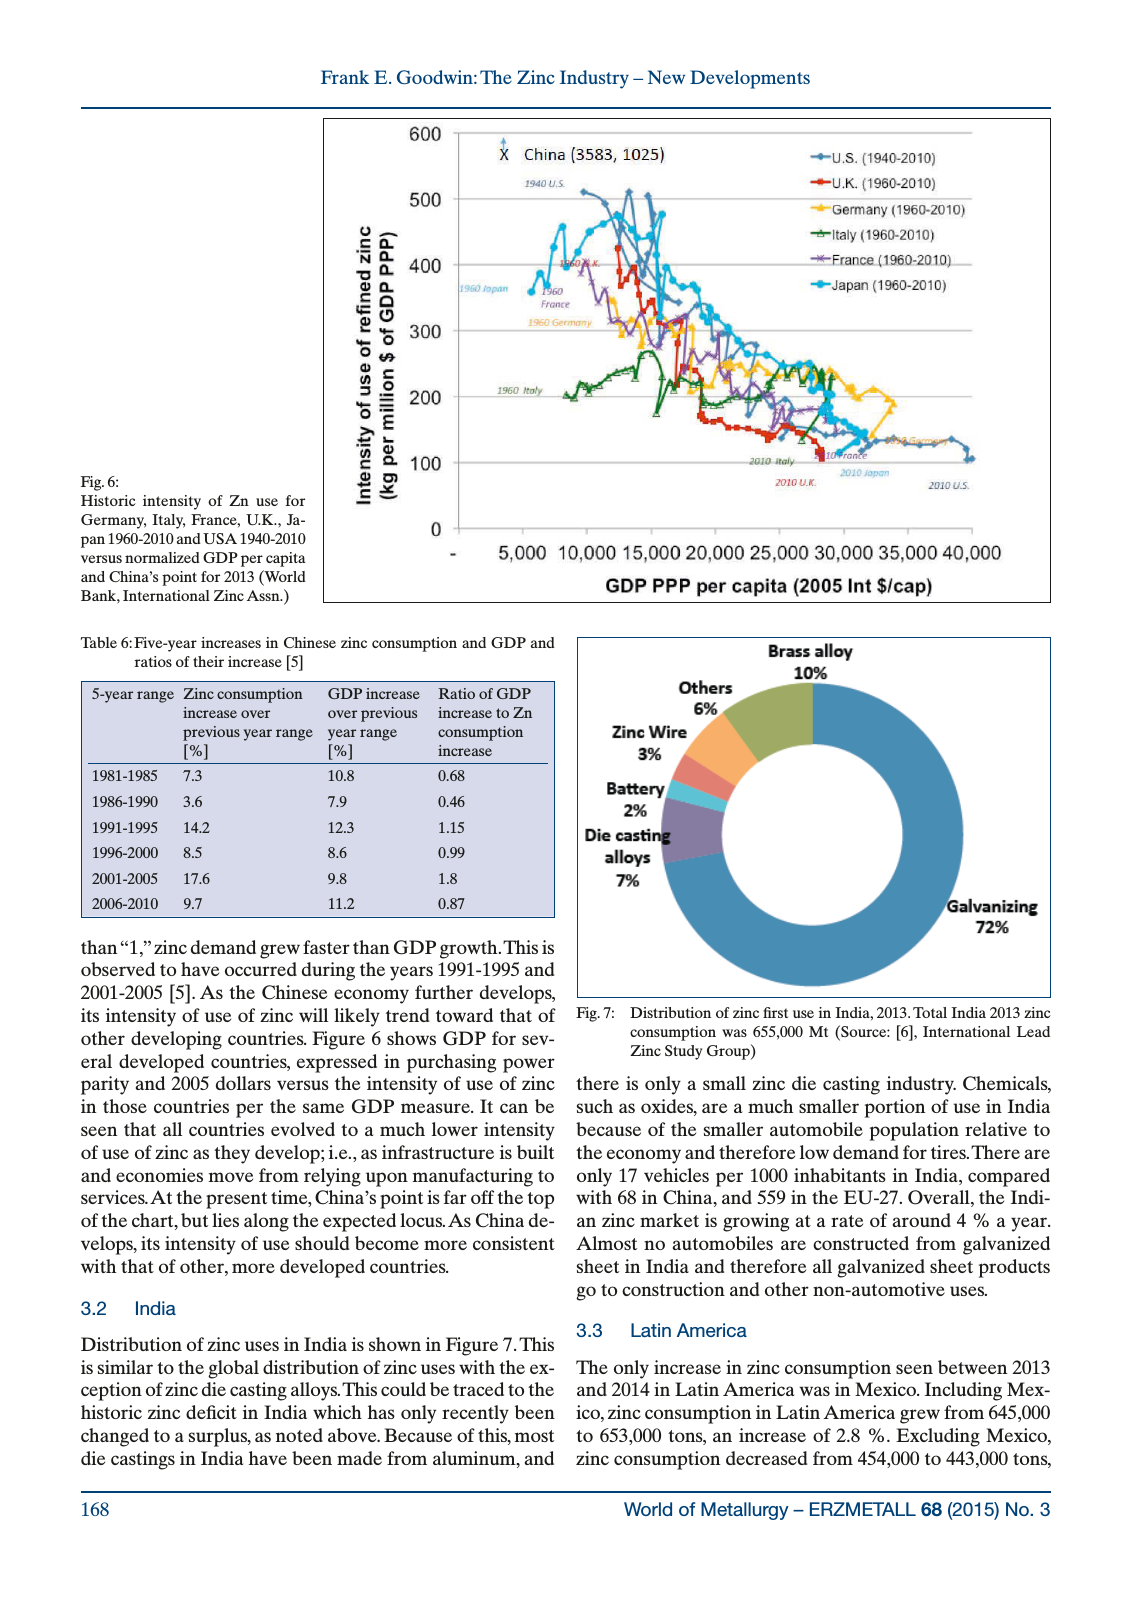
World of Metallurgy ERZMETALL 68 2015 No 3168 Frank E Goodwin The Zinc Industry New Developments than 1 zinc demand grew faster than GDP growth This is observed to have occurred during the years 1991 1995 and 2001 2005 5 As the Chinese economy further develops its intensity of use of zinc will likely trend toward that of other developing countries Figure 6 shows GDP for sev eral developed countries expressed in purchasing power parity and 2005 dollars versus the intensity of use of zinc in those countries per the same GDP measure It can be seen that all countries evolved to a much lower intensity of use of zinc as they develop i e as infrastructure is built and economies move from relying upon manufacturing to services At the present time China s point is far off the top of the chart but lies along the expected locus As China de velops its intensity of use should become more consistent with that of other more developed countries 3 2 India Distribution of zinc uses in India is shown in Figure 7 This is similar to the global distribution of zinc uses with the ex ception of zinc die casting alloys This could be traced to the historic zinc deficit in India which has only recently been changed to a surplus as noted above Because of this most die castings in India have been made from aluminum and there is only a small zinc die casting industry Chemicals such as oxides are a much smaller portion of use in India because of the smaller automobile population relative to the economy and therefore low demand for tires There are only 17 vehicles per 1000 inhabitants in India compared with 68 in China and 559 in the EU 27 Overall the Indi an zinc market is growing at a rate of around 4 a year Almost no automobiles are constructed from galvanized sheet in India and therefore all galvanized sheet products go to construction and other non automotive uses 3 3 Latin America The only increase in zinc consumption seen between 2013 and 2014 in Latin America was in Mexico Including Mex ico zinc consumption in Latin America grew from 645 000 to 653 000 tons an increase of 2 8 Excluding Mexico zinc consumption decreased from 454 000 to 443 000 tons Table 6 Five year increases in Chinese zinc consumption and GDP and ratios of their increase 5 5 year range Zinc consumption increase over previous year range GDP increase over previous year range Ratio of GDP increase to Zn consumption increase 1981 1985 7 3 10 8 0 68 1986 1990 3 6 7 9 0 46 1991 1995 14 2 12 3 1 15 1996 2000 8 5 8 6 0 99 2001 2005 17 6 9 8 1 8 2006 2010 9 7 11 2 0 87 Fig 6 Historic intensity of Zn use for Germany Italy France U K Ja pan 1960 2010 and USA 1940 2010 versus normalized GDP per capita and China s point for 2013 World Bank International Zinc Assn Fig 7 Distribution of zinc first use in India 2013 Total India 2013 zinc consumption was 655 000 Mt Source 6 International Lead Zinc Study Group aa
Hinweis: Dies ist eine maschinenlesbare No-Flash Ansicht.
Klicken Sie hier um zur Online-Version zu gelangen.
Klicken Sie hier um zur Online-Version zu gelangen.